Haiti 2010 Crisis Analysis
Academic Risk & Disaster Analysis Project
Theme: Crisis Management, Disaster Risk, Governance Failure, Vulnerability & Resilience
Tools / Frameworks: PAR Model, Excel, Pivot Tables, SPSS, ArcGIS, EM-DAT, INFORM Risk Index
Context:
This project analysed the 2010 Haiti earthquake as a disaster-risk and crisis-management case study. Rather than treating the earthquake as a purely natural event, the report examined how long-term vulnerability, weak institutions, urban exposure, poor construction, fragmented governance, and external actor coordination failures shaped the scale of the disaster.
The project sat within my wider interest in crisis management and strategy. It allowed me to explore how disasters are not only caused by hazards, but also by the systems that exist before the hazard occurs: governance structures, infrastructure quality, poverty, planning, communication, and institutional capacity.
The report used Haiti as a high-risk case because the country is exposed to multiple hazards, including earthquakes, storms, droughts, and floods. The 2010 earthquake was therefore analysed not as an isolated event, but as one moment inside a broader pattern of chronic vulnerability.
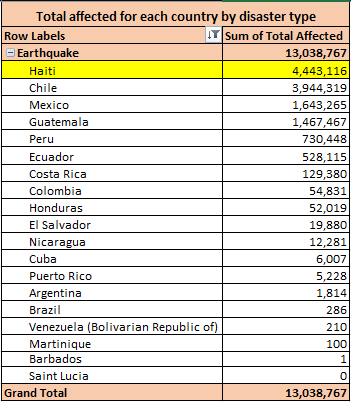
Figure 1: Excel screenshot showing how big of a problem this is for haiti.Also an example of how pivot tables were used to conduct this research.
Problem:
The central problem explored in this project was why the 2010 Haiti earthquake became so catastrophic.
A magnitude 7.0 earthquake struck near Port-au-Prince in 2010, producing mass casualties, displacement, building collapse, and severe institutional disruption. However, a later earthquake in 2021 had a similar magnitude but produced far fewer deaths. This comparison raised the key analytical question:
Why did the 2010 earthquake produce such extreme impact?
The report argued that the answer was not earthquake magnitude alone. The disaster was produced by the interaction between hazard exposure and structural vulnerability: dense urban settlement, weak building codes, fragile governance, poverty, limited medical capacity, poor coordination, and pre-existing institutional weakness.
My Role:
My role was to research, analyse, and critically interpret the 2010 Haiti earthquake through disaster-risk and crisis-management frameworks.
I collected and analysed disaster data, reviewed academic and policy literature, built visual evidence using Excel and ArcGIS, and structured the argument around the Pressure and Release model. I also explored correlations using SPSS, although the most useful findings came from descriptive and comparative analysis rather than statistically significant correlation results.
This project required me to think like a risk analyst: not just asking what happened, but why the system failed, which vulnerabilities existed beforehand, and what lessons could be drawn for future disaster-risk reduction.
Method:
The project used a mixed analytical approach combining theory, secondary data analysis, visual mapping, and critical evaluation.
I used Excel heavily to clean and organise disaster data, build pivot tables, apply filters, compare disaster types, and create graphs showing affected populations, deaths, disaster frequency, and damage patterns. This helped me move beyond narrative description and support the report with structured evidence. For example see figure 1,2.
Figure 2: Use of pivot tables in the analysis for this report.
I also used SPSS to explore possible correlations in the data. While this did not produce meaningful correlation findings, it was still useful because it helped me understand the limits of the dataset and reinforced the need to interpret disaster outcomes through theory and context rather than forcing statistical relationships where the data did not support them.
A key visual component of the project was created using ArcGIS. I mapped the locations of the 2010 and 2021 earthquake epicentres and compared them on a single image alongside population-density context. This helped show why two earthquakes with similar magnitudes could produce very different human consequences.
The report was structured using the Pressure and Release model, which explains disasters as the result of root causes, dynamic pressures, unsafe conditions, and hazard events. I also drew on ideas from complex adaptive systems, high-reliability organisations, disaster governance, and resilience theory.
Figure 3: Population density and Map of the two earthquakes that took place in haiti made using ArcGis
Output:
The final output was a critical risk and disaster analysis report on the Haiti 2010 earthquake.
The report found that Haiti’s disaster impact could not be explained by seismic intensity alone. Instead, the earthquake became catastrophic because multiple layers of vulnerability aligned at the same time: weak governance, poor construction, dense urban exposure, inadequate healthcare capacity, fragmented NGO coordination, communication failure, and limited disaster preparedness.
The analysis also compared Haiti’s 2010 and 2021 earthquakes to show that magnitude alone does not determine disaster severity. The 2010 event struck a far more exposed and densely populated urban area, while the 2021 earthquake affected less urbanised regions. This supported the argument that vulnerability, population density, and institutional capacity shaped mortality more strongly than the hazard itself.
The report concluded with recommendations for future disaster-risk reduction, including stronger building-code enforcement, improved institutional coordination, better early-warning systems, community-level disaster education, local capacity building, and more integrated governance between national authorities, NGOs, and external actors.
Skills Applied:
Disaster-risk analysis
Complex systems thinking
Excel data cleaning
Pivot tables
descriptive & comparative analysis
Graphing
ArcGIS mapping
Secondary data analysis
Policy analysis
Risk interpretation
Key Insight:
The biggest insight from this project was that disasters are not purely natural.
The earthquake was the trigger, but the disaster was produced by the conditions that existed before it: poverty, weak institutions, fragile infrastructure, informal construction, poor coordination, and limited preparedness. This changed how I think about crisis management. A crisis is rarely just the visible event. It is often the result of hidden system weaknesses accumulating over time.
The comparison between the 2010 and 2021 earthquakes made this especially clear. Similar hazards can produce very different outcomes depending on where they occur, who is exposed, how buildings are constructed, how institutions respond, and whether society has built resilience before the event.
Reflection:
This was one of the most enjoyable projects I worked on because it brought together several things I find genuinely interesting: crisis management, geography, data analysis, governance, systems thinking, and real-world strategy.
I enjoyed the process of moving between different types of evidence. The Excel work helped me understand Haiti’s wider disaster profile through data. The ArcGIS map helped me visualise exposure and location. The literature helped me interpret why the impact was so severe. The PAR model then gave me a structure to connect all of these layers into one argument.
The SPSS work was also useful, even though it did not produce meaningful correlations. It reminded me that not all data analysis leads to clean statistical findings. Sometimes the value lies in understanding what the data cannot show and then choosing a better analytical approach. In this case, theory-led interpretation, visual comparison, and contextual analysis were more useful than forcing a statistical relationship.
This project strengthened my interest in crisis strategy and risk advisory work. It showed me how important it is to understand the systems behind a crisis: institutions, incentives, infrastructure, communication, and vulnerability. It also made me realise that good crisis analysis requires both technical tools and judgement. Data can show patterns, but interpretation is what turns those patterns into useful recommendations.
